Posts

Showing posts from October, 2023

100+ years of the Dow Theory and the Yerkes-Dodson Law

Image
The Dow Theory and the Yerkes-Dodson Law have an impact on today's stock markets based on human psychology in the following ways: 1. Dow Theory and Human Psychology: The Dow Theory, developed by Charles Dow and later refined by William Hamilton and Robert Rhea, is one of the foundational principles of technical analysis in the stock market. It is based on the idea that stock market trends are composed of three phases: primary trends (bull and bear markets), secondary trends (corrections within primary trends), and minor trends (daily fluctuations). Relevance Today:  The principles of Dow Theory still hold because they describe the behavior of market participants and the cyclical nature of markets. Investors continue to observe primary trends, secondary trends, and minor trends in the stock market. Technical analysts use these principles to make predictions about future market movements, and many traders and investors still find value in these concepts. Trend Following and Human Beh

Active and reactive traders

Image
In the stock market, traders can be broadly categorized into two main types: active traders and reactive traders. These classifications are based on their trading strategies, approaches, and behaviors. 1. Active Traders: Active traders are individuals or institutions who engage in frequent and regular buying and selling of stocks and other financial instruments. They typically have a proactive approach to the market and may make multiple trades in a single day. Here are some key characteristics of active traders: Day Traders: Day traders buy and sell securities within the same trading day, aiming to profit from short-term price movements. They often rely on technical analysis and are highly focused on intraday price fluctuations. Swing Traders: Swing traders hold positions for several days to weeks, seeking to capture price swings or trends. They may use both technical and fundamental analysis. Scalpers: Scalpers make very quick and small trades, attempting to profit from tiny price

FOMO - Fear of Missing Out.

Image
Identifying FOMO (Fear of Missing Out) in stock trading often involves recognizing specific thought patterns and behaviors that traders exhibit when they are influenced by this emotion. Here are some mind patterns and behaviors that can help you identify FOMO in stock trading: 1. Urgency to Enter a Trade: Traders under the influence of FOMO tend to feel an urgent need to enter a trade immediately, often without conducting thorough research or analysis. They fear missing out on a potentially profitable opportunity and act hastily. 2. Chasing Momentum: Traders exhibiting FOMO often chase stocks that have already experienced significant price increases. They want to ride the momentum, even if the stock is overvalued, which can lead to losses. 3. Fear of Regret: Traders with FOMO may fear regretting not taking a specific trade more than the fear of losing money. They prioritize avoiding the emotional distress of missing out over sound financial decision-making. 4. Lack of Patience: FOMO-d

Self-awareness and self-reflection.

Image
Traders often become acutely aware of their mistakes and shortcomings but may find it difficult to prevent or rectify them. This awareness can lead to frustration as traders realize their errors but struggle to control their actions or emotions effectively.  Here's a breakdown of this concept: 1. Increased Awareness: As traders gain experience and become more engaged in stock trading, they naturally become more aware of their mistakes, suboptimal decisions, and areas where they could improve. This heightened awareness can result from a deeper understanding of the market, regular self-evaluation, or learning from past trading experiences. 2. Inability to Stop Mistakes: Despite being aware of their mistakes, traders may find it challenging to stop themselves from repeating these errors. This can happen for various reasons, including emotional responses like fear, greed, or impatience, which can cloud judgment and lead to the same mistakes being made repeatedly. 3. Frustration: The

Positive trading emotions

Image
While excessive emotions like fear and greed can lead to impulsive and irrational decisions, positive emotions such as motivation, desire, and interest can be harnessed to improve trading performance. Here's how these emotions can be beneficial: 1. Motivation: Motivation is a driving force that compels traders to take action and achieve their goals. In stock trading, motivation can push traders to continually improve their skills, follow their trading plans, and stick to their strategies. It can be a source of resilience, helping traders bounce back from losses and stay committed to their trading objectives. Motivated traders are more likely to put in the time and effort required to analyze the market, make informed decisions, and adapt to changing conditions. 2. Desire: Desire in trading is the aspiration to achieve financial success and reach specific trading goals. It provides a sense of purpose and direction in trading. A strong desire to succeed can lead traders to learn more

Negative trading emotions

Image
Stock trading is a complex and emotionally charged activity, and various psychological factors can lead to costly mistakes. Here are some common stock trading mistakes caused by emotions like fear, greed, anger, lack of confidence, and overconfidence: 1. Fear: Overreacting to Market Volatility: Traders often panic and sell stocks when the market experiences a downturn, locking in losses. Avoiding Good Opportunities: Fear can prevent traders from entering the market or taking advantage of potentially profitable opportunities. 2. Greed: Chasing High Returns: Traders may become overly aggressive and invest in high-risk assets or speculative stocks in the hope of making quick, substantial gains. Neglecting Risk Management: Greed can lead to inadequate risk management strategies, such as not setting stop-loss orders or diversifying a portfolio. 3. Anger: Revenge Trading: Traders who experience losses due to the market or their own mistakes may seek revenge by making impulsive and irrati

Yerkes-Dodson Law

Image
The Yerkes-Dodson law is a psychological principle that describes the relationship between arousal (stress or stimulation) and performance. It suggests that there is an optimal level of arousal for performance, and performance deteriorates when arousal is too high or too low. While the Yerkes-Dodson law is primarily a psychological concept, it can be applied to the stock market to some extent. Here's how you can think about it in the context of the stock market: 1. Optimal Arousal Level : The Yerkes-Dodson law suggests that there is an optimal level of arousal or stress for optimal performance. In the stock market, this can be related to your level of engagement and decision-making. If you are too complacent and not paying enough attention, you might miss opportunities or make poor decisions. On the other hand, if you are constantly stressed and react emotionally to market fluctuations, you may also make poor decisions. 2. Balancing Arousal and Performance : To apply the Yerkes-Do

How to trade supply zones - Drop Base Drop and Rally Base Drop.

Image
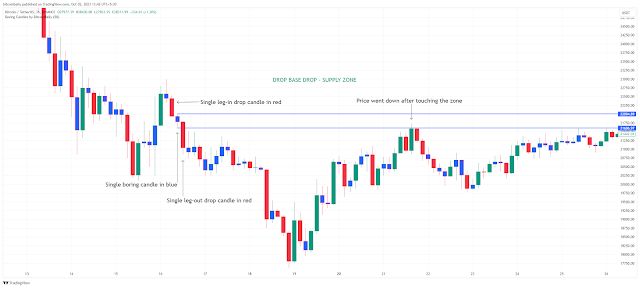
  BTC/USDT 3 hours chart - DROP BASE DROP Pattern Above is an example of a Drop Base Drop supply pattern. The pattern is having ... 1. One leg-in candle in red. 2. One leg-out candle in red. 3. One base candle in blue. The price came up touched the supply zone, and went down. This indicates that the supply zone had some pending sell orders. BTC/USDT 3 hours chart - RALLY BASE DROP Pattern Above is an example of a Rally Base Drop supply pattern. The pattern is having... 1. One leg-in candle in green. 2. One leg-out candle in red. 3. One base candle in blue. The price came up touched the supply zone, and went down. This indicates that the supply zone had some pending sell orders. Below are the features of a powerful supply zone. 1. Should have 1-3 base candles. 2. Should have two or more leg-out candles. 3. Should cross and go below one or more recent support levels.

How to trade demand zones - Rally Base Rally and Drop Base Rally.

Image
  BTC/USDT daily chart - RALLY BASE RALLY Above is an example of a Rally Base Rally demand pattern. The pattern is having ... 1. One leg-in candle in green. 2. One leg-out candle in green. 3. Two base candles in blue. In the 2nd candle after the leg-out candle, the price came down touched the demand zone, and went up. This indicates that the demand zone had some pending buy orders. BTC/USDT daily chart - DROP BASE RALLY Above is an example of a Drop Base Rally demand pattern. The pattern is having... 1. One leg-in candle in red. 2. Two leg-out candles in green. 3. One base candle in blue. The price came down touched the demand zone, and went up, this indicates that the demand zone had some pending buy orders. Below are the features of a powerful demand zone. 1. Should have 1-3 base candles. 2. Should have two or more leg-out candles. 3. Should cross and go above one or more recent resistance levels.