Posts

Showing posts with the label bitcoinbaily

Swing nature of price action

Image
While both Dow Theory and Elliott Wave Theory involve the concept of swings, they approach them in different ways, and the terminology and principles used in each theory may differ. Let's explore how swings are defined in Dow Theory and Elliott Wave Theory: Dow Theory Swings:  In Dow Theory, the concept of swings is related to the primary, secondary, and minor trends. The primary trend is the long-term direction of the market, while secondary and minor trends represent shorter-term fluctuations within the primary trend. Primary Swings: These are the major movements in the primary trend. In an uptrend, primary swings consist of higher highs and higher lows, while in a downtrend, they consist of lower highs and lower lows. Secondary Swings: These are corrections or counter-trend movements within the primary trend. In an uptrend, secondary swings are declines (lower highs and lower lows), and in a downtrend, they are rallies (higher highs and higher lows). Minor Swings: These are s...

100+ years of the Dow Theory and the Yerkes-Dodson Law

Image
The Dow Theory and the Yerkes-Dodson Law have an impact on today's stock markets based on human psychology in the following ways: 1. Dow Theory and Human Psychology: The Dow Theory, developed by Charles Dow and later refined by William Hamilton and Robert Rhea, is one of the foundational principles of technical analysis in the stock market. It is based on the idea that stock market trends are composed of three phases: primary trends (bull and bear markets), secondary trends (corrections within primary trends), and minor trends (daily fluctuations). Relevance Today:  The principles of Dow Theory still hold because they describe the behavior of market participants and the cyclical nature of markets. Investors continue to observe primary trends, secondary trends, and minor trends in the stock market. Technical analysts use these principles to make predictions about future market movements, and many traders and investors still find value in these concepts. Trend Following and Human Beh...

Active and reactive traders

Image
In the stock market, traders can be broadly categorized into two main types: active traders and reactive traders. These classifications are based on their trading strategies, approaches, and behaviors. 1. Active Traders: Active traders are individuals or institutions who engage in frequent and regular buying and selling of stocks and other financial instruments. They typically have a proactive approach to the market and may make multiple trades in a single day. Here are some key characteristics of active traders: Day Traders: Day traders buy and sell securities within the same trading day, aiming to profit from short-term price movements. They often rely on technical analysis and are highly focused on intraday price fluctuations. Swing Traders: Swing traders hold positions for several days to weeks, seeking to capture price swings or trends. They may use both technical and fundamental analysis. Scalpers: Scalpers make very quick and small trades, attempting to profit from tiny price...

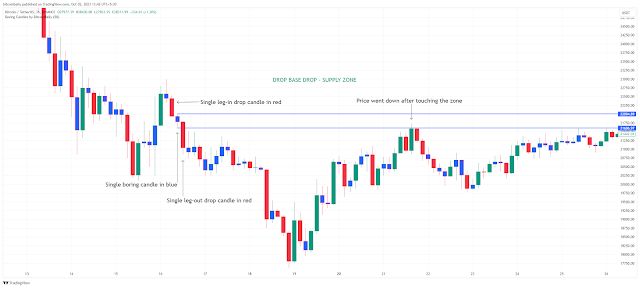
How to trade supply zones - Drop Base Drop and Rally Base Drop.

Image
  BTC/USDT 3 hours chart - DROP BASE DROP Pattern Above is an example of a Drop Base Drop supply pattern. The pattern is having ... 1. One leg-in candle in red. 2. One leg-out candle in red. 3. One base candle in blue. The price came up touched the supply zone, and went down. This indicates that the supply zone had some pending sell orders. BTC/USDT 3 hours chart - RALLY BASE DROP Pattern Above is an example of a Rally Base Drop supply pattern. The pattern is having... 1. One leg-in candle in green. 2. One leg-out candle in red. 3. One base candle in blue. The price came up touched the supply zone, and went down. This indicates that the supply zone had some pending sell orders. Below are the features of a powerful supply zone. 1. Should have 1-3 base candles. 2. Should have two or more leg-out candles. 3. Should cross and go below one or more recent support levels.

How to trade demand zones - Rally Base Rally and Drop Base Rally.

Image
  BTC/USDT daily chart - RALLY BASE RALLY Above is an example of a Rally Base Rally demand pattern. The pattern is having ... 1. One leg-in candle in green. 2. One leg-out candle in green. 3. Two base candles in blue. In the 2nd candle after the leg-out candle, the price came down touched the demand zone, and went up. This indicates that the demand zone had some pending buy orders. BTC/USDT daily chart - DROP BASE RALLY Above is an example of a Drop Base Rally demand pattern. The pattern is having... 1. One leg-in candle in red. 2. Two leg-out candles in green. 3. One base candle in blue. The price came down touched the demand zone, and went up, this indicates that the demand zone had some pending buy orders. Below are the features of a powerful demand zone. 1. Should have 1-3 base candles. 2. Should have two or more leg-out candles. 3. Should cross and go above one or more recent resistance levels.

How are moving averages used in algorithmic trading.

Image
Moving averages are a popular technical indicator used in algorithmic trading. They are used to smooth out price data and identify trends. There are two major types of moving averages: simple moving averages (SMAs) and exponential moving averages (EMAs). SMAs are calculated by taking the average of the closing prices over a specified period of time. For example, a 50-day SMA would take the average of the closing prices for the past 50 days. EMAs are similar to SMAs, but they give more weight to recent price data. This makes EMAs more responsive to changes in price, but also more volatile. Moving averages can be used in a variety of ways in algorithmic trading. One popular strategy is to use a moving average crossover. This strategy involves buying a security when its moving average crosses above another moving average, and selling it when the moving average crosses below the other moving average. Another popular strategy is to use a moving average as a stop-loss. This means that you wo...

Formation of a boring candlestick between bullish and bearish exciting candlesticks in a uptrend.

SUPPLY ZONE(RALLY BASE DROP)

Image
A rally base drop(RBD) is a price pattern that forms when the market rises, reaches a peak, and then sharply drops. The pattern is characterized by three phases: A sharp rise in price, which is usually driven by buying pressure from bulls. A period of sideways price action, which is often characterized by narrow trading ranges and low volatility. This phase is sometimes referred to as the "base" of the pattern. A sharp drop in price, which is usually driven by selling pressure from bears. The rally base drop pattern is considered to be a bearish reversal pattern, as it suggests that the bulls have lost control of the market and the bears are now in charge. Traders who identify this pattern can look to enter short positions on a breakout from the base. Here are some of the key features of a rally base drop pattern: The first candle in the pattern is usually a large bullish candle, which indicates a significant rally. The second candle in the pattern is often a doji or s...

Formation of a boring candlestick between a bearish exciting and bullish exciting candlesticks in a downtrend.

DEMAND ZONE(DROP BASE RALLY)

Image
BTC/USDT monthly chart A drop base rally( DBR ) is a price pattern that forms when the market falls, enters a period of sideways price action, and finally shows an explosive move upwards. The pattern is characterized by three phases: A sharp drop in price, which is usually driven by selling pressure from bears. A period of sideways price action, which is often characterized by narrow trading ranges and low volatility. This phase is sometimes referred to as the "base" of the pattern. A sharp rise in price, which is usually driven by buying pressure from bulls. The drop base rally pattern is considered to be a bullish reversal pattern, as it suggests that the bears have lost control of the market and the bulls are now in charge. Traders who identify this pattern can look to enter long positions on a breakout from the base. Here are some of the key features of a drop base rally pattern: The first candle in the pattern is usually a large bearish candle, which indicates a si...